Data Patterns Driving Player Retention in Digital Card and Wagering Platforms
Written by Logan Reed · Aug 12, 2026

Data Patterns Driving Player Retention in Digital Card and Wagering Platforms
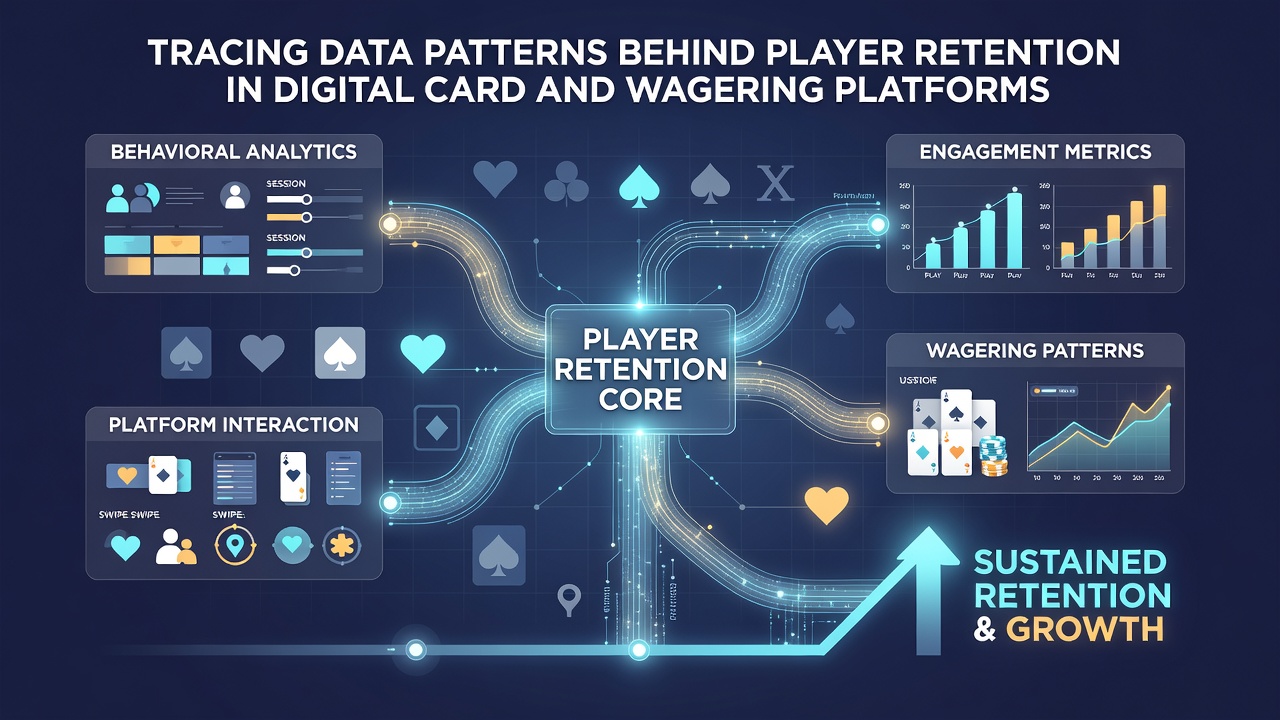
Digital card platforms and wagering systems generate vast streams of behavioral information that operators use to identify factors influencing continued participation, and researchers examine these streams through structured analytics frameworks that track variables such as login frequency, average session length, and deposit intervals. Studies released in August 2026 by independent analytics groups highlighted how early interaction sequences often correlate with longer-term activity across multiple jurisdictions.
Core Metrics Collected by Platform Operators
Operators record timestamps for every game round, wager size, and outcome while also logging device types and geographic indicators that together form player profiles, yet they aggregate this information into cohort groups to compare retention curves without exposing individual records. Data shows that cohorts with consistent weekly logins maintain higher activity levels than those with sporadic patterns, and machine learning models process these signals to forecast departure risks weeks in advance.
Session duration serves as another central indicator because extended play periods frequently precede sustained engagement, whereas brief visits that end without deposits tend to signal higher attrition probabilities according to aggregated reports from North American and European operators. Payment method variety also appears in retention calculations since users who link multiple funding sources demonstrate different longevity metrics than single-method participants.
Predictive Models and Their Inputs
Analysts apply supervised learning techniques to historical datasets that include win-loss ratios, bonus redemption rates, and social feature usage, while unsupervised clustering identifies subgroups whose behaviors diverge from platform averages. One study conducted by researchers affiliated with the University of Nevada Reno examined over two million player records and isolated three distinct retention clusters based on time-of-day preferences and game variety selection.
Churn prediction accuracy improves when models incorporate external variables such as regulatory changes or seasonal events, and operators in Canada have reported that integrating provincial tax filing periods into their datasets refined forecast precision by measurable margins. These models output risk scores that trigger targeted communications designed to re-engage at-risk users through personalized offers calibrated to past behavior patterns.
Geographic and Regulatory Variations in Data Practices
Regulatory frameworks in different regions shape the granularity of data operators may retain and analyze, with the Australian Communications and Media Authority requiring detailed reporting on harm minimization metrics that indirectly influence retention tracking methodologies. In contrast, frameworks overseen by the Nevada Gaming Control Board emphasize transaction integrity and responsible gaming disclosures that feed into the same analytical pipelines.
Cross-border platforms must reconcile these requirements when merging datasets, and industry associations such as the European Gaming and Betting Association publish guidelines that help standardize certain retention indicators across member organizations. Observers note that platforms operating under multiple licenses often maintain parallel data warehouses to satisfy each jurisdiction while still generating unified retention reports for internal strategy.
Behavioral Signals Linked to Continued Participation
Frequency of game-type switches within a single session correlates with extended account lifespan in several large-scale analyses, and users who explore both card variants and sports wagering options show distinct retention trajectories compared with single-category participants. Deposit timing patterns also matter because users who add funds immediately after a loss event sometimes exhibit different longevity than those who deposit following wins.
Community features including chat integration and leaderboard participation appear in retention studies as positive indicators, and one longitudinal review of Canadian provincial platforms found measurable differences in return rates between cohorts that used these tools and those that did not. Time-stamped event logs allow analysts to map these behavioral sequences into decision trees that highlight critical junctures where intervention may alter outcomes.
Conclusion
Retention analysis in digital card and wagering environments rests on systematic collection and interpretation of behavioral datasets that reveal patterns across time, geography, and user subgroups. Regulatory bodies from varied regions continue to shape permissible data practices while industry reports and academic studies supply the benchmarks against which individual platforms measure performance. As datasets grow and modeling techniques advance, operators gain clearer pictures of the sequences that sustain participation over months and years.